Let's be real - your GPA isn't exactly setting the world on fire. Maybe you had a rough freshman year, or perhaps trigonometry just wasn't your thing. But here's the plot twist you've been waiting for: that Ivy League acceptance letter? Still. Totally. Possible.
You're probably thinking, 'Yeah, right!' But stick with me here. Here at A-One Institute, after years of helping students navigate the college admissions maze , we've seen some amazing success stories that'll make you rethink everything you've heard about Ivy League requirements.
Today, we are spilling the tea on how real students with less-than-perfect GPAs have landed spots at these dream schools. No sugar-coating, no false promises - just straight facts and actionable strategies that could be your ticket in.
Buckle up, because we're about to break down exactly how to turn your Ivy League dreams into reality, even if your GPA isn't what you wished it was!
Before we dive in, please acknowledge that there is a certain threshold of GPA and SAT scores when applying to top-tier universities. If your GPA and SAT score ranges are extremely distant from the average ranges of admits, unfortunately it will be a very difficult battle.However, for those who are slightly below or don't feel too confident, there are strategies that can maximize your chances. This article will focus on how strategically applying to niche majors can boost applications.
In recent years, we have seen a trend of students preferring STEM majors such as Engineering, Medical studies and Computer Science and Business for non-STEM majors.
If a student decides to pursue a highly competetive major at a top-tier university but don't feel competent enough, opting for a different major could be a strategy. This strategy often involves getting acceptance to the university and later transferring within the institution. Do keep in mind though this strategy requires careful research on the transfer policies which are specific to each university and majors.

According to CollegeBoard, approximately 1.7 miillion students take the SAT annually. The graph in the above image is based on a survey of students who graduated high school in 2017, tracking their SAT/Math/Reading/Writing scores, high school GPA, and their performance during the first and second years in college. It's important to note that surveying the entire 1.7 million student population is impractical, so this chart is drawn from a sample of around 50,000 students chosen to match racial distributions.

Above table displays the distribution of majors for a sample of 58,000 students, divided into broad categories.
Descriptive Statistics by Academic Major

The table shows the SAT scores of successful applicants, their high school GPAs, and their tracked academic performance in the first and second years of university for each major. If we simplify this table for easier comprehension, it would look something like the table below.
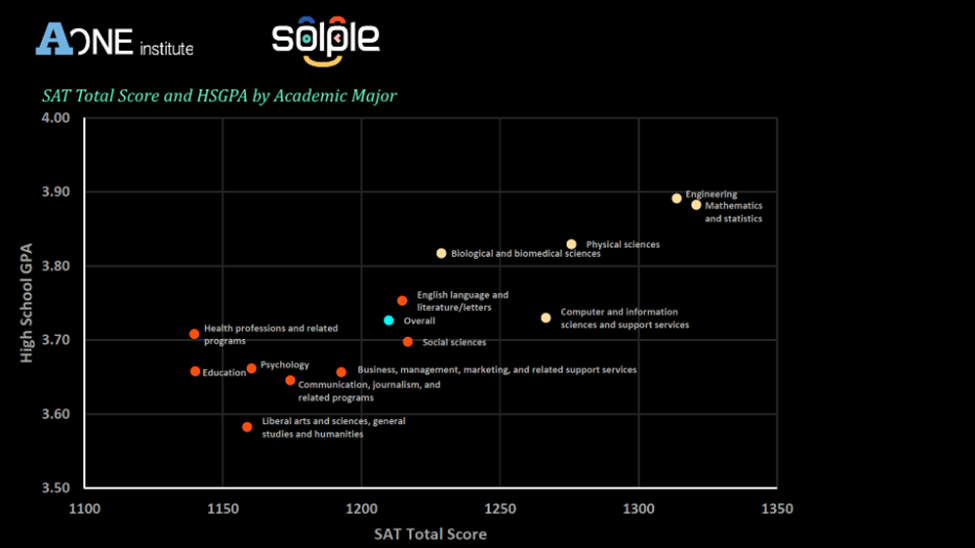
The x-axis represents the SAT Total Score, while the y-axis represents the High School GPA. However, the SAT score of 1350 mentioned here represents the overall average from a sample of 58,000 students who took the SAT- do not interpret this number as a standard for entry into those majors. Majors with higher SAT/GPA distributions include Engineering, Math, and Statistics, which admit students with both high SAT and GPA scores.
Statistics like these highlight that fields like Mathematics and Statistics, despite being mistaken for less competitive due to being considered Natural Sciences, actually have high competition due to their demand in various industries. Similarly, Engineering, being a popular choice, also faces tough competition.
Majors with relatively higher acceptance rates include Education, Psychology, Communication, Journalism, Liberal Arts, and Sciences. These fields are known for relatively higher acceptance rates despite slightly lower SAT/GPA scores.
A point of caution: Health professions and related programs often refer to fields excluding Bio-Medical Sciences, which are positioned lower left on the chart than they ideally should be.

The table above displays SAT ERW (English Reading & Writing) scores and SAT Math Scores categorized by Academic Major. The horizontal axis represents SAT ERW, while the vertical axis represents SAT Mathematics. Departments selected by students with lower scores are located towards the lower left, while those chosen by students with higher scores are positioned towards the upper right.
Majors chosen by students with relatively low SAT/GPA include:
-
Liberal Arts and Sciences, General Studies, and Humanities.
-
Psychology
-
Education
-
Communication, Journalism, and related programs. A decade ago, these majors were highly competitive, but due to changes in the industrial structure, they have shifted to lower positions.
In essence, selecting a major from these departments could increase your chances of gaining admission to a higher-level university.
The above data represents SAT Total and SAT Tilt by Academic Major. It indicates Math Tilt on the horizontal axis and English Tilt on the vertical axis. A skew towards the right of the center suggests students excel more in Math than English. The further left indicates students are better in English than in Math. This data showcases the majors chosen by students.
As expected, majors skewed toward the right include Mathematics, Statistics, and Engineering. These popular STEM majors are often chosen by students proficient in Math. Students stronger in English tend to select majors related to English or Language. However, Biomedical fields are located near the center. It's crucial to note that students aspiring to medical sciences should excel not just in Math but also in English.

In conclusion, analyzing the data reveals that majors in the lower left corner, chosen by students with relatively low SAT/GPA, include:
-
Psychology
-
Education
-
Communication, Journalism, and related programs
-
Liberal Arts and Sciences, General Studies, and Humanities
When applying to a specific school, if a student feels the chosen major is highly competitive and their chances are lower, opting for a different major among those listed above might enhance their admission prospects.
For instance, non-STEM fields can be bypassed for English or Humanity-related majors, while STEM fields might take a detour towards Psychology.
Among these, the categories of Liberal Arts and Sciences, General Studies, and Humanities are quite extensive, warranting separate explanation.

The upper-left group comprises majors related to English, such as English, Languages, Literature, and Comparative Literature. Below are Humanity-related majors, including Philosophy, History, Anthropology, Archaeology, Ancient World, and Ethnic Studies. The center constitutes a broader area related to History or Humanity, including Modern World, Hispanic Literature, History of Art, Architecture, Gender & Sexuality Studies, Religious Studies, and Social Sciences. On the right are majors related to smaller regional cultures or social studies like Italian Studies, African Studies, Egyptology, Assyriology, American Studies, Judaic Studies, German Studies, French & Francophone Studies, East Asian Studies, and Middle Eastern Studies.
Remembering these departments might be helpful. In essence, we aim not to advocate for these specific departments but to assist students in raising their level to a reputable school within their GPA/SAT scores.
For students passionate about studying a specific major, don't forget the strategy of selecting schools based on your major rather than just their reputation!
The advice shared today should be considered when applying to college with completed GPA/SAT scores. We discourage advance preparation solely targeting low-competition courses as the goal. The best approach is to choose a major you genuinely want: Prepare in advance and strive to meet the qualifications for the desired school and major.
If you're still pursuing your goal as a student, use this content as a reference. For those currently applying to college, refer to this and hope for successful outcomes.
GPA
Ivy League