
The Numbers Are In. Here's What They Actually Mean.
Admissions results for the Class of 2030 — students enrolling in fall 2026 — are now public, and most institutions have released their official data. At A ONE Institute, we track these numbers across roughly twenty top universities to identify patterns that are genuinely useful for students currently preparing their applications. This article walks through the data school by school and then pulls back to identify the broader trends shaping what's ahead.
One note on approach: the school ordering here follows our internal tracking sequence, not a ranking. Focus on the patterns and trends for each institution rather than their position in the list.
School-by-School Breakdown: Class of 2030 Data
Princeton
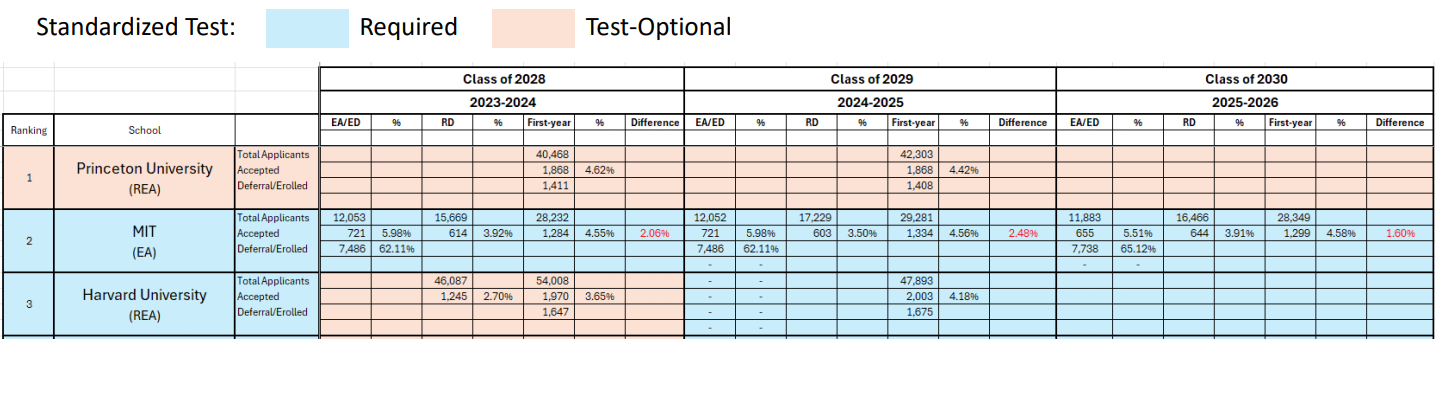
Princeton releases minimal Early decision data — the university publishes only aggregate totals rather than Early-specific breakdowns. What the data shows: the overall applicant pool continues to grow, and the Class of 2030 cycle saw more applications than the Class of 2029 cycle. Historical admit rates across recent classes have remained relatively stable, hovering in the mid-single digits.
MIT
MIT's return to required standardized testing triggered a notable drop in applications — from approximately 33,700 to roughly 26,000 — as students who might have submitted under test-optional policies chose not to apply. Admit rates have since stabilized in the mid-4% range: 4.11%, 3.96%, 4.8%, then 4.5%, 4.56%, and 4.58% for this year's cycle. The numbers are remarkably consistent. Applications this cycle decreased slightly year-over-year, and the number of acceptance letters issued — approximately 1,299 — also came in slightly lower than last year.
Harvard
Harvard's application volume declined sharply after the university reinstated standardized testing requirements, dropping from a peak of over 61,000 to approximately 47,800. The removal of test-optional policies effectively filtered out students who were applying without meaningful competitive credentials — what might be described informally as aspirational applications without supporting scores. Volume is expected to recover somewhat as the policy stabilizes, and the projected admit rate for the Class of 2030 likely falls somewhere between 3.65% and 4.18%.
Harvard is also notable for its deferral behavior: in a typical Early cycle, roughly 7,000–9,000 students are deferred, with a final enrollment yield from that deferred pool of only around 740 students. That means approximately 90% of deferred students are ultimately not admitted. Students deferred by Harvard should treat that outcome as a strong signal rather than a meaningful continuation of their application.
Stanford
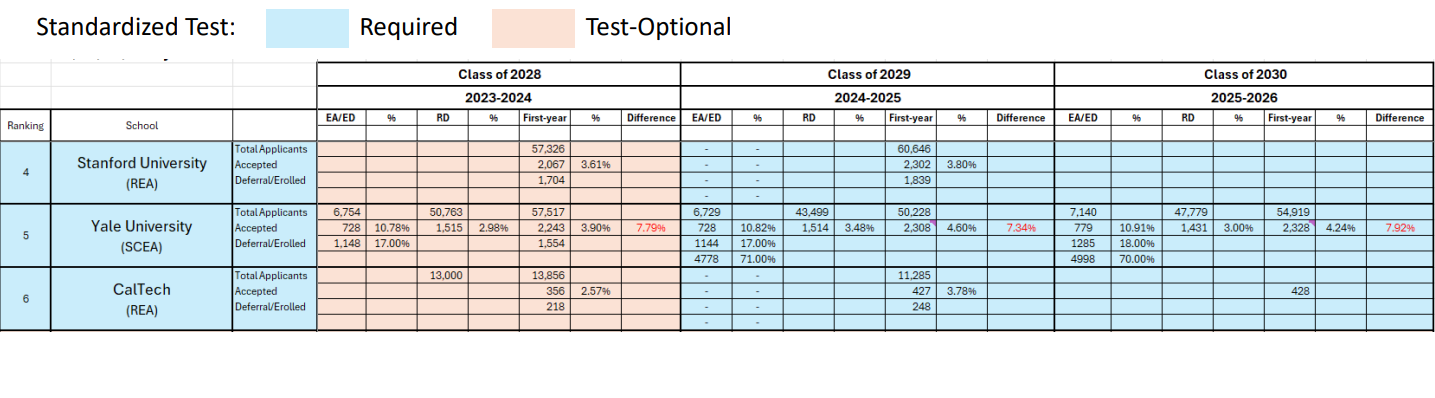
Stanford is one of the few schools where total applications actually increased after standardized testing was reinstated — from 57,326 to higher. This suggests that Stanford's test-optional applicant pool was already relatively self-selected, meaning fewer students applied purely on aspirational grounds even without a testing requirement. Full Class of 2030 admit rate data from Stanford is expected around October; acceptances are projected to exceed last year's 2,300 figure.
Yale
Yale provides particularly clean longitudinal data. Application volume dropped significantly after testing requirements returned — roughly 7,000 fewer applicants — before recovering in this cycle. The Class of 2030 saw both an increase in total applicants and a substantial increase in acceptance letters issued: 2,328 letters compared to 2,308 the year prior.
The most notable Yale data point this cycle is QuestBridge: Yale nearly doubled its QuestBridge acceptances, from 66 to 118. For students who qualify for QuestBridge based on income and academic achievement, this is a significant and direct signal. Apply through QuestBridge if you're eligible — the numbers show Yale is actively prioritizing this pathway.
Caltech
Caltech data is limited, but the available figures show a consistent pattern: application volume declined after testing was reinstated, and acceptance letter totals increased — from 356 to 417 to approximately 428. For a school that admits under 500 students per year, that's a meaningful proportional increase.
Duke
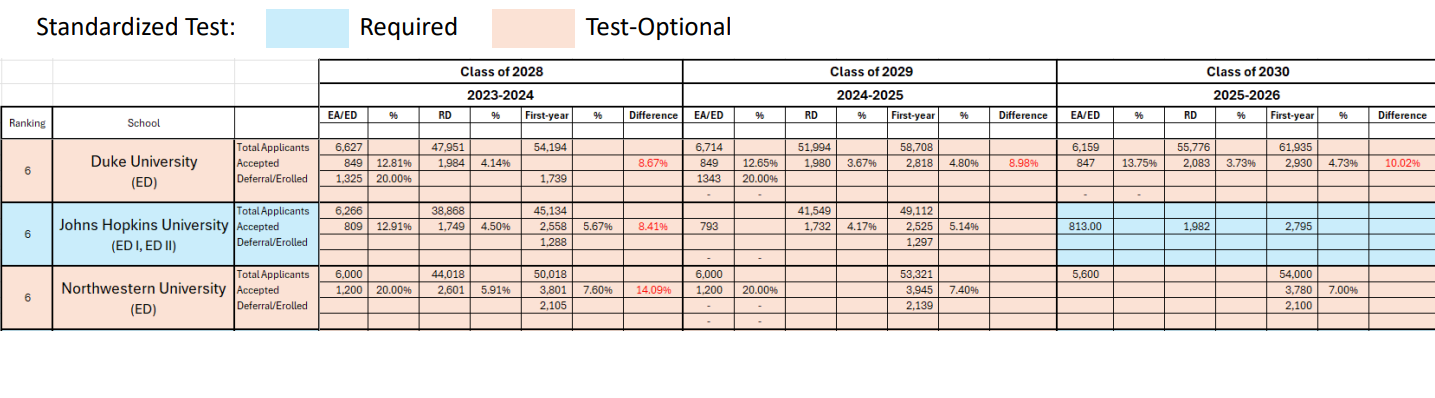
Duke's applicant pool grew from 54,000 to 58,000 to 61,000 across the past three cycles. Acceptance letters increased alongside it — from 2,818 to 2,930. The Early admission premium at Duke exists but is relatively modest compared to schools like Northwestern and Dartmouth.
Johns Hopkins
Johns Hopkins reinstated testing requirements this cycle, which is expected to produce the same pattern seen at other schools — a decline in total applications. Despite that likely drop, the number of acceptance letters issued increased substantially: from 2,525 to 2,795. This reflects the broader trend described below.
Northwestern
Northwestern is one of the clearest examples of a school where Early Decision provides a significant strategic advantage. The Early admit rate — currently around 20% — is roughly 14 to 15 percentage points higher than the Regular Decision rate of approximately 5.91%. Historically, Northwestern's Early rate was even higher, reaching 25% at certain points, and even as it has moderated, it remains among the largest Early-Regular gaps of any highly selective university. Total applications have grown from approximately 50,000 to 53,000 to 54,000, following the same upward trend seen elsewhere.
UPenn
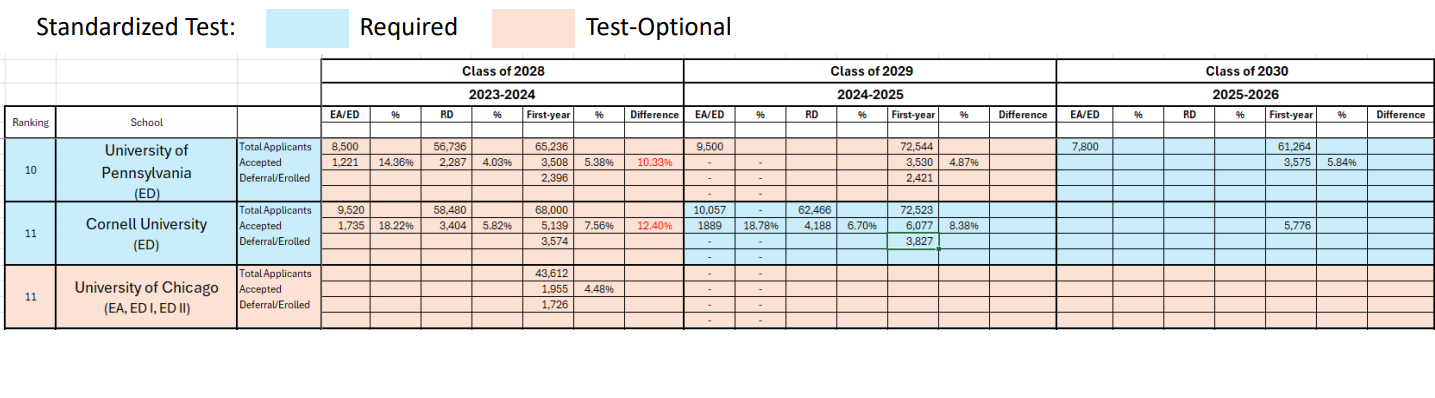
Penn's application trajectory followed the reinstatement pattern: volume peaked near 72,000 under test-optional conditions, then dropped to approximately 61,000 after testing requirements returned. Despite lower application volume, acceptance letter totals increased: from 3,508 to 3,530 to 3,575.
Cornell
Cornell is one of two schools — along with Stanford — where total applications actually increased after testing was reinstated, reflecting strong demand from students confident in their scores. Acceptance letter totals jumped substantially before pulling back slightly for this cycle. Cornell's Early admission premium is historically significant — Early vs. Regular gaps have exceeded 14 percentage points in some recent years — and even as that gap has narrowed, it remains among the higher Early advantages at Ivy League institutions. Cornell also admitted approximately 1,700 students through Early Decision, one of the largest Early cohorts of any school on this list.
Brown
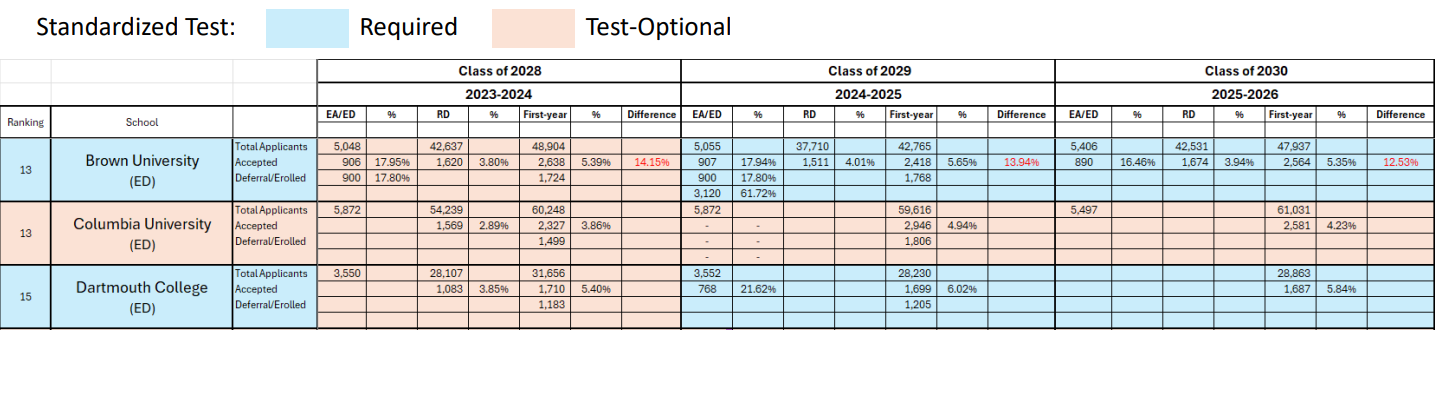
Brown's application data follows the standard reinstatement pattern: volume dropped from approximately 48,900 to 42,000 after testing requirements returned, and is expected to recover. Acceptance letters increased from 2,418 to 2,564. Brown's Early admission premium is meaningful — the Early admit rate is notably higher than Regular Decision — making it one of the schools where Early application carries real strategic value.
Columbia
Columbia's application volume increased year-over-year for the Class of 2030, while acceptance letters came in slightly lower than last year. No dramatic shifts in either direction.
Dartmouth
Dartmouth is among the schools with the most pronounced Early admission advantage. The gap between Early and Regular admission rates is substantial, making it one of the clearest cases where applying Early meaningfully improves a student's odds.
Rice
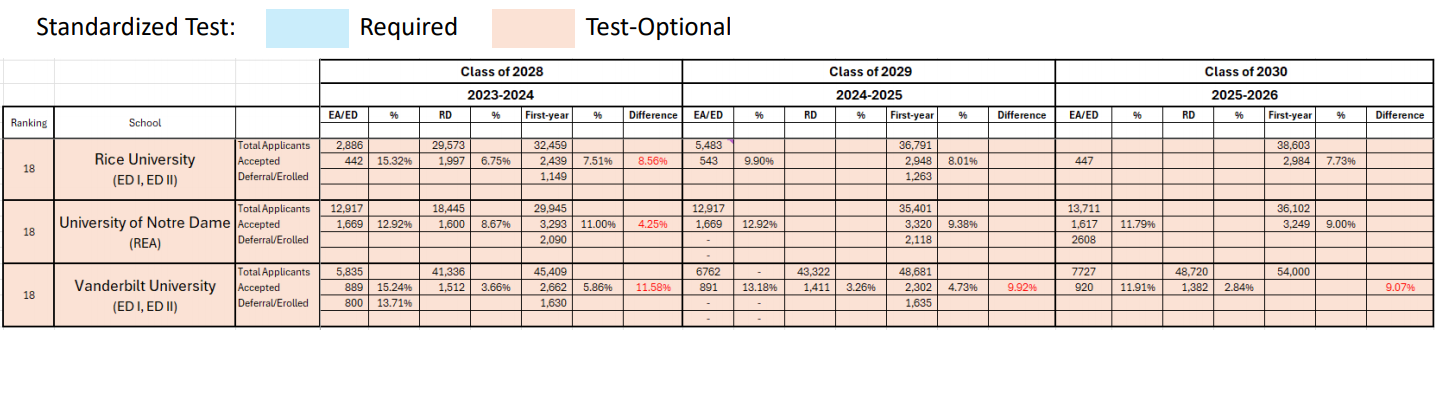
Rice introduced Early Decision II starting with the Class of 2029, which effectively doubled the size of the Early applicant pool — from roughly 2,700 to over 5,400. Enrollment figures increased alongside this change: from approximately 2,400 to nearly 3,000 students per year. For students considering Rice, this structural change means the school is now accepting meaningfully more students than it did in prior years.
Notre Dame
Notre Dame is notable for the absence of a significant Early admission premium. The gap between Early and Regular admission rates is relatively small — around 4 percentage points — compared to schools like Northwestern, Dartmouth, and Brown where the gap can exceed 15 points. For Notre Dame specifically, applying Early provides limited additional advantage, and Regular Decision is a viable alternative for students whose applications need more time to develop.
Vanderbilt
Vanderbilt's total applicant pool has grown substantially and consistently. On the deferral question specifically, Vanderbilt stands out: the school issues relatively few deferrals, which means that students who are deferred have a higher probability of ultimately being admitted than at schools like Harvard or MIT, where deferrals function almost identically to rejections. If you receive a deferral from Vanderbilt, it's worth continuing to pursue that application actively.
The Broader Trend: What These Numbers Show Together
Looking across the seventeen schools with complete data, two patterns stand out.
Total applications grew by approximately 2.13% year-over-year. That's meaningful, but the more important figure is what happened to acceptance letters: they increased by 4.86% — more than twice the rate of application growth. Universities are issuing acceptance letters at a faster rate than the applicant pool is growing.
This reflects a structural dynamic that has emerged as students increasingly apply to more schools simultaneously. Common App data confirms that the average number of schools per applicant grew from 6.41 to 6.59 this cycle. When a single student applies to ten or twelve schools and receives multiple acceptances, they enroll at one and decline the rest. For universities trying to hit enrollment targets, the response is to issue more acceptance letters to offset the higher yield loss.
The practical implication: for academically competitive students, top universities are issuing more acceptances than they were two to three years ago, even as the composition of the applicant pool has shifted. International student enrollment has declined significantly under current federal policy — and yet total applications to top schools have still grown, suggesting that domestic applicants are applying more broadly and more ambitiously. Against that backdrop, acceptance volume is increasing at a rate that outpaces application growth.
This is, on balance, a favorable development for strong applicants. Students who might have been just below the threshold for an acceptance letter in the 2022 or 2023 cycles are more likely to receive one now. The preparation required hasn't changed — competitive applicants still need strong academics, meaningful research and extracurricular depth, and a coherent application narrative. But the numerical probability of translating that preparation into an acceptance has improved modestly.
Where Early Decision Still Matters Most
Based on the Class of 2030 data, the schools where Early application provides the most meaningful advantage — measured by the gap between Early and Regular admit rates — are:
Dartmouth, Northwestern, Brown, and Cornell show the most pronounced Early premium among Ivy and near-Ivy institutions. Cornell's combination of a large Early cohort (approximately 1,700 students) and a historically significant admit rate gap makes it particularly notable for students who are confident Cornell is their top choice.
Harvard, MIT, and Stanford show smaller Early advantages or explicitly state that Early and Regular rates are not meaningfully different for comparably prepared students. At these schools, the decision to apply Early should be driven by genuine readiness rather than statistical arbitrage.
Notre Dame shows minimal Early premium, making Regular Decision a genuinely comparable option for applicants to that school.
On Deferrals: Not All Are Created Equal
For students navigating deferral decisions, the data points in a clear direction.
At Harvard and MIT, a deferral should be understood as a near-rejection. The number of deferred students who ultimately enroll is small relative to the deferral pool — roughly 10% at Harvard — making a deferral from these schools a poor basis for optimism.
Schools where deferred students have materially better odds of ultimately being admitted include, in approximate order: Vanderbilt, Duke, UPenn, Johns Hopkins, and Northwestern. Receiving a deferral from any of these schools is worth taking seriously as an active application — strong midyear updates and a thoughtful continued interest letter can meaningfully influence the outcome.
At A ONE Institute, we track admissions data across major universities each cycle to help students understand not just where the opportunities are, but how to position themselves within those opportunities. If you have questions about how this data applies to a specific school list or application strategy, we're here to help.
college admissions trends
Early Decision strategy
Ivy League admit rates
college admissions
